Reaction norms have traditionally been formulated deterministically, so as an organism's developmental status is assumed to change exactly at the time it hits the reaction norm.
Two alternative survival analyses based modeling approaches for describing ontogenetic transition processes in continuous time are proposed by the authors. The models are simplified compared to previous models but are easier to use in terms of modelling effort and data requirements. Therefore, they provide user-friendly and broadly applicable tools for continuous time analyses for typical ontogenic transition data sets, as well as for predicting transitions at very fine time scales. The authors examine performance of the models using empirical data on timing of metamorphosis in the common frog, Rana temporaria.
All equations reproduced here have the same reference numbers as in the original article for ease of use. A brief summary of the models is presented below and taken largely from the paper the original of which is provided in a link at the end of this post. Any errors in the summary are mine and the orignal should be referred to by those interested in this topic.
Survival analysis based approaches for ontogenetic life-history transitions
Ontogenetic transition processes are of a type where an individual ages, and at some point in time experiences an event that can only occur once for each individual. In medicine, this kind of process is investigated using survival analyses, the name deriving from the fact that the considered event is often death. The starting point for survival analysis is to assume that the probability that an event will occur is governed by a rate h(t), which is usually called the hazard. If the mathematical form for how this changes with t is known, then the probability that the event (e.g. maturation or death) will not occur before time t, denoted as S(t) and called the survivor function, can be calculated by
 (2)
(2)Or, if time is discrete, the probability that nothing happens before time t is the product of the probabilities of nothing happening in each time step before t. Typically, survival analyses use data on the times to events (T) to ask how the hazard function or, equivalently, the survivor function is affected by different covariates.
The paper proposes two alternative modelling approaches that relax the effort of composing the exact analytical form of the hazard, by directly making assumptions about the survivor function, and how it is affected by the covariates.
1. A Parametric Survival Analysis
The model used in the paper reduces modelling effort to a parametric survival regression in which the distribution of an individual's survival time T (i.e. the time it takes until an individual faces the transition event) is modelled directly by
 (3)
(3)where α is an intercept parameter, β is a vector of free model parameters, x is a vector of optional covariates, σ is a scale parameter (also a free model parameter) describing variance in the data, ε is a random variable, following some distribution, and f is a link function appropriate for the distribution of given ε.
The estimated parameters of eqn (2) can be used directly for assessing how much variation is induced to the timing of the transition event by the covariates.
Once the parameters of the survivor function have been estimated, the paper explains how model can be used to predict the occurrence of transitions.

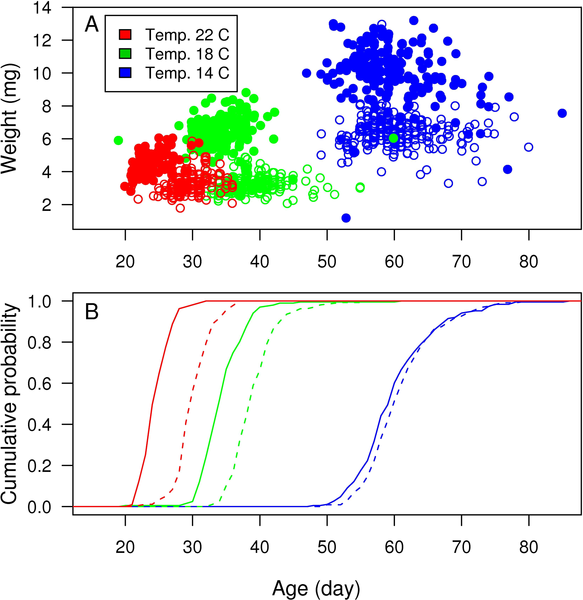
Figure 1. Timing of metamorphoses of common frog (Rana temporaria) reared in a common garden experiment.
Individuals are exposed to three temperature and two food level (ad libitum or restricted) treatments. In both panels, growth temperatures are indicated with colours (see colour legend), and restricted food is indicated with open circles/dashed line, and ad libitum feeding with filled bullets/solid line. Individual observations of ages and weights at metamorphosis are shown in panel A. Cumulative probabilities for the timing of metamorphoses calculated from the raw data are shown in panel B.
2 Semi-parametric Survival Analysis.
A method developed by Cox performed an analysis of survival data by splitting the model into two parts: 1) the survival function, which only depends on time, and 2) a term for the ratio of the hazards (i.e. rates of the events) for different classes (the proportional hazards model). This modelling approach is particularly convenient if interest lies on the proportional effects of the covariates on T, rather than the distribution of T itself. The Cox proportional hazards model assumes that the effects of the covariates are multiplicative, so that the survival probability S(t) = P(T>t) is given by
 (4)
(4)where β and x are as above, t is any freely chosen time point, and P0 (t) is a baseline hazard function that gives the probability P(T≤t x = 0). The authors state that the Cox regression is very convenient in the sense that no underlying distribution for the transition time needs to be assumed. Similarly, when assessing the proportional effects of the explanatory variables on S(t), P0 does not have to be known either. It is only required for estimating the actual survival probability S(t) = P(T>t). From these, predictions for transition probabilities can be derived for any time interval similarly as above.

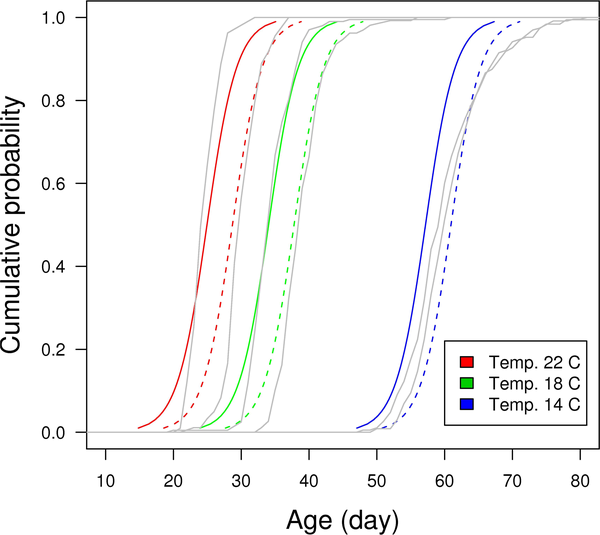
Figure 2. Cumulative probabilities for the timing of metamorphoses predicted by the parametric survival model (eqn. 3).
Different growth temperatures are indicated with different colours, and different food level treatments with different line types (solid line = ad libitum, dashed line = restricted food). Gray lines beneath the estimated cumulative probabilities are the observed cumulative distributions for the timing of metamorphosis.
The models presented in the paper make the concept of probabilistic modelling of ontogenetic life-history transitions in continuous time more easily accessible. Transition data can be analysed which is typically available from the wild with little prior knowledge of mechanisms underlying transitions. As random effects can be incorporated into the model survival based models can be used to estimate genetic variability in transition probabilities by using data obtained from breeding under controlled conditions or through the use of genetic markers. The aquaculture industry is an obvious possible user of these models.
Of particular interest to me is that survival based models would be useful in studies investigating and predicting patterns of metamorphosis in insects and amphibians. The authors conclude that more generally, the models should aid the concept of probabilistic reaction norm becoming as general and applicable tool in the studies of life-history variation as the deterministic reaction norms are today.
The article can be found here at PloS One.


No comments:
Post a Comment